

Local councils represent a level of government that often escapes serious inspection. While ‘closer to the people’, local governments are rarely held to account for how they spend ratepayer funds. All ratepayers, whether they be residential or commercial property owners, are unwilling funders of largess, however for the majority of these time-precious citizens, analysing local government finances is not the most pressing priority.
Ratepayers’ apathy towards the activities of local government may explain the lack of public outrage given the 63 percent increase in WA council rates over the past decade. Over the same period, only the costs of tobacco, electricity, water, medical and childcare services have increased faster.[1]
What do each of these have in common? All are heavily regulated sectors with high levels of government involvement.
To provide a structured approach for analysing waste and mismanagement, Mannkal has commenced the building of a new Western Australian Local Government Financial Database (the “WALG Financial Database”). Mannkal researchers will analyse the financial statements of local governments to paint a clear picture and track exactly where, and how, ratepayers’ money is being raised and spent.
Ratepayers understand that exponential growth in council rates is a symptom of a larger problem. The ever-increasing scope of local government responsibilities has meant the traditional “roads, rates and rubbish” are neglected for non-traditional services. Such is the scope creep that WALGA President Lynne Craigie and Opposition Leader Liza Harvey respectively confirmed that local government has “become everything and anything” and that “there are lots of gaps that local government are looking likely to pick up”.
The blurring of functions between local and state governments hinders the capacity of local governments to raise revenue in a transparent way. This is illustrated particularly within the current COVID-19 climate, with the State government encouraging local government to “do its bit” in reducing the burden on households.
The project began by analysing several councils with a legacy of inefficiency, including the City of Subiaco, Town of Vincent, City of Cambridge and City of Perth. Each of these governments have adopted budget and financial strategies that see a zero percent rate increase for the next financial year. A reduction in council rates may be favourably looked upon by most constituents, however without an equivalent scaling back of responsibilities, revenue shortfalls are made up through council borrowings or grants which are inadvertently paid for by Western Australians through (among others) income, sales or stamp duty taxes. Heroic indeed.
Another central question is how ratepayers’ money is being spent. For analytical and philosophical purposes, the project categorises local government spending into “core” and “non-core” expenditures. Core services focus on the basics of keeping the community safe, clean and moving. Non-core services describe all of the additional “responsibilities” local governments now fulfil which depart from the traditional “roads, rates and rubbish”. This includes, among many others, “free” community concerts and support services for local businesses. Such services are inadvertently funded by local ratepayers whether or not they use the service. In these cases, funding on a user-pays capacity would reduce much of the existing rate burden for households and businesses.
Local councillors, in search of the votes of small pockets of self-interested constituents have endorsed, and pushed, the foray of local government into non-core services. As a result, the non-compulsory electoral system councils operate under has created countless non-core services. If put to a referenda, or tested by market demand, most would likely be unsupported by the majority of constituents. Western Australia’s peak local government lobbying body, WALGA, supports the provision of these non-traditional local government services which have become entrenched in local government organisational structures, proudly acknowledging that local government “touches almost all areas of our day to day life as citizens”. This circular justification of offering these services is also done out of self-interest. The more councils expand, the more WALGA demands. This means jobs, conferences, and international meetings. All funded, indirectly, by ratepayers.
One example of this is the City of Vincent’s recent announcement stating its ambition to become the arts capital of Perth. The creative desires of Vincent’s council, however, should come as no surprise to voters, given its history of venturing into ideologically driven activities outside its scope. For about 15 years, the council engaged in large-scale political grandstanding, after declaring itself a nuclear-free zone.
Given the unclear mandate councils operate under, it is not a surprise that preliminary analysis by Mannkal analysts indicates that non-core activities dominate the expenditure of all four councils. Illustrated in the chart below is a breakdown of the expenditure of local councils into functional categories for the most recent financial year. Local ratepayers would likely be concerned to hear that recreation and culture-related expenditures are major outlays in all councils (and are the number one expense item in Vincent and Subiaco). This category, while including the activities and services to do with things such as parks, libraries and recreation centres, also professes a broader aim of supporting the “social wellbeing of the community”. Not only is this a wide net for councillors to cast, it usually results in inequitable transfers of wealth.
Breakdown of Council Expenditures by Function
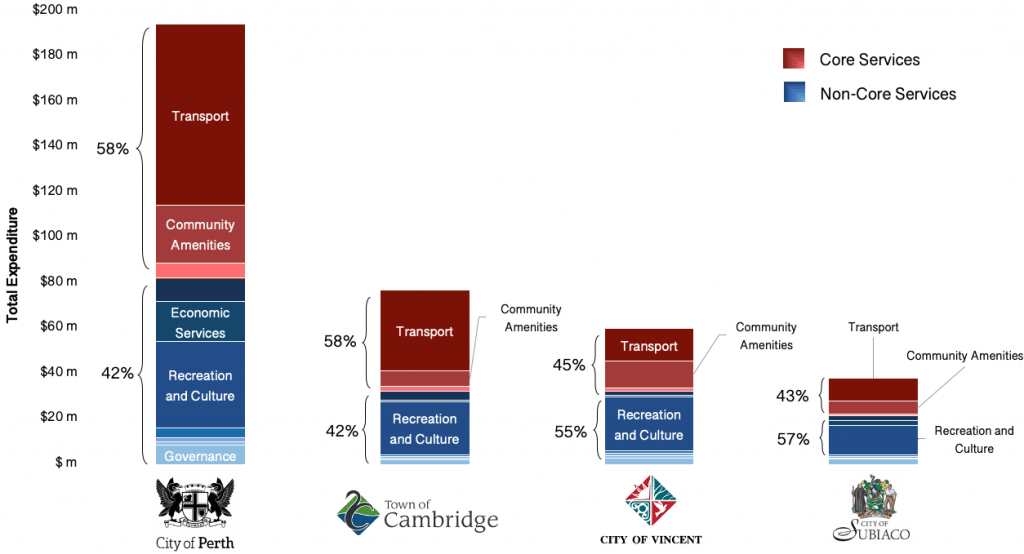
Users of services such as community recreation centres or libraries commonly pay less than the cost of provision, with the remainder of the cost burden spread over ratepayers not using the services. This usually means that households of university students or young families subsidise the gym or library memberships of the elderly (who already receive discounted pensioner rates).
Employee costs also make up a significant portion of total expenditure in three out of the four councils. Notably, in its 2018/19 annual report, the City of Perth vowed to restore its focus on transparency after its bloated Elected Member entitlements were exposed which saw ratepayers footing the bill for dining room, grooming, personal donations and clothing expenses. These privileges are indication of a systematic problem within a council which has been put into administration on multiple occasions.
Aside from the Town of Cambridge, all councils displayed employee costs that comprised upwards of 40 percent of total expenditure. Notably, the City of Subiaco’s workers make up a sizeable 53 percent of the councils’ total expenditures. While the Town of Cambridge’s employee cost figures may appear lower, it is likely that much of these equivalent expenses have been shifted to materials and contracts spending, which has increased 206 percent since 2014.
2019 Employee Costs vs. Other Expenditures by Council

This project will analyse the financial statements of other metropolitan councils, with the aim of establishing a broader dataset to independently benchmark the performance of West Australian local governments. Mannkal researchers hope to aid the ability of ratepayers to make their own judgements about the efficiency of their local government’s operations. This will stimulate discussion and identify areas of largess so that relief may be provided to ratepayers who have been picking up the tab for many years.
[1] Australian Bureau of Statistics Consumer Price Index, March 2020. https://www.abs.gov.au/AUSSTATS/abs@.nsf/DetailsPage/6401.0March%202020?OpenDocument